You're Measuring the Wrong Things. Here's What Actually Tells You If Your Engineering Team Is Healthy.

President, Zaruko
Table of Contents
Your engineering team is probably tracking something. Story points, maybe. Sprint velocity. Open tickets. Bugs closed.
None of those, on their own, tell you much about whether your team can deliver reliably.
DORA gives us the research backbone: deployment frequency, lead time, change failure rate, and recovery time. But for many mid-market companies that are not deeply instrumented, three practical proxies are often enough to spot trouble early: release frequency, planning accuracy, and defect escape rate. Most teams either don't track them or don't know what they're looking at when they do.
The Story Point Problem
Story points were designed as a planning tool, not a performance metric. Their inventors have said as much repeatedly. Ron Jeffries, one of the creators of Extreme Programming, has written that story points should never have become a management metric. They were meant to help teams estimate relative effort for their own planning, not to let managers judge output from the outside.
When story points become a target, engineers game them. Estimates inflate. Work that could be a 3 becomes a 5. The numbers start reflecting the incentive, not the effort. The data stops meaning anything.
The same problem applies to most common engineering metrics. Lines of code written, tickets closed, PRs merged, hours logged. These are all activity metrics. They tell you something is happening. They say nothing about what is being produced.
The Three Metrics That Matter
Release Frequency
How often does working software ship to production? Not commits. Not feature flags. Not code merged to main. Actual releases, available to actual users.
This is the most honest proxy for whether a team's process is working. A team that ships consistently, on a predictable schedule, has a functioning delivery pipeline, clear definitions of done, and enough organizational alignment to get things over the finish line. A team that ships erratically has problems somewhere in that chain.
Google's DORA research, which has surveyed more than 39,000 software professionals over a decade, draws the sharpest distinction here.1 Elite engineering teams deploy multiple times per day. High performers deploy daily to weekly. Medium performers deploy weekly to monthly. Low performers deploy monthly or less. In 2024, the high-performing cluster shrank from 31% of respondents to just 22%, while the low-performing cluster grew from 17% to 25%.1
The gap between elite and low performers isn't a matter of degree. It is a different operating model.
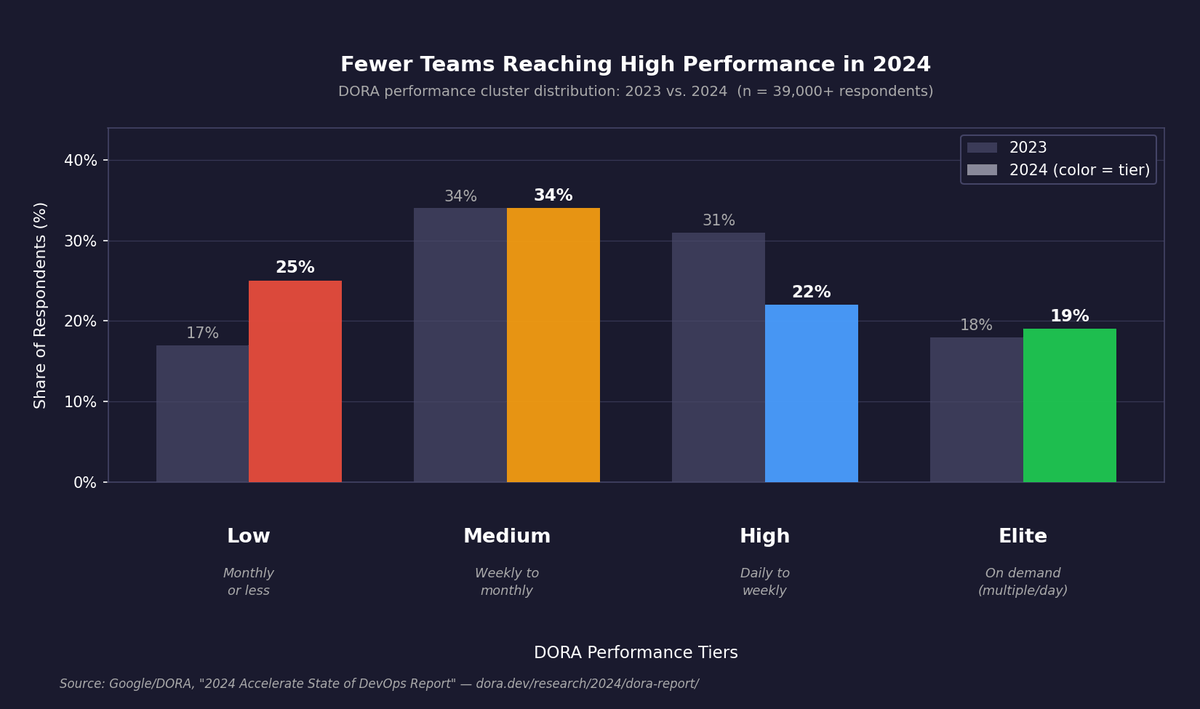
Figure 1. Distribution of engineering teams across DORA performance tiers, 2023 vs. 2024. The high-performing cluster shrank from 31% to 22% while the low-performing cluster grew from 17% to 25%. Source: Google/DORA, 2024 Accelerate State of DevOps Report.
Planning Accuracy
What percentage of sprint work actually gets done in a sprint?
This metric is underused because it feels like an indictment of the engineering team. It shouldn't. A team that consistently completes 60 to 70 percent of committed work isn't a bad team. It is a team with an information problem. Something is distorting estimates: unclear requirements, hidden technical debt, scope that expands after the sprint starts, dependencies on other teams that nobody accounted for.
If committed work regularly slips across multiple sprints, that is a signal of unclear scope, hidden dependencies, or poor estimation inputs. The gap between what the team knows when it commits and what it learns after it starts is always fixable. But you can't fix it if you aren't measuring it.
A team with consistently high planning accuracy isn't necessarily working harder. It is operating with better information at the point of commitment, which usually means clearer requirements, better upfront analysis, or shorter sprints with smaller scope.
Defect Escape Rate
How many bugs reach production?
This tells you something specific about quality discipline that few other metrics expose as directly. A team with high deployment frequency and high defect escape rate is not a high-performing team. It is a fast team with a trust problem. Every release is a gamble.
Defect escape rate connects directly to how the team defines "done." A team that ships when code is reviewed and merged defines done differently than a team that ships when code is reviewed, tested, merged, and observed in production for 24 hours. Neither definition is wrong for all situations. But whatever definition the team uses should be explicit and consistently applied.
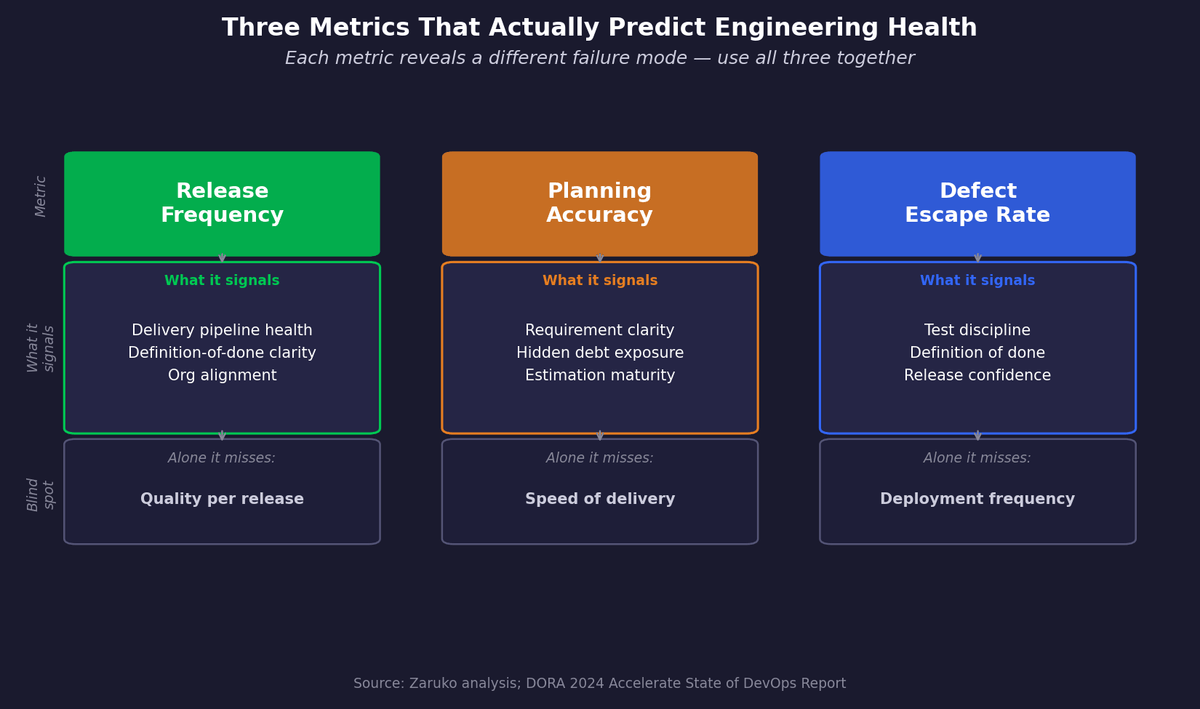
Figure 2. The three metrics that predict engineering team health, what each signals, and what each fails to tell you on its own.
The KPI Overload Failure Mode
There is an opposite problem from tracking the wrong things: tracking too many things.
When a team has twenty metrics on a dashboard, no one knows which ones to act on. Meetings become data review sessions. Engineers spend time generating reports rather than fixing problems. Leadership gets a false sense of visibility.
Strong engineering teams keep the measurement surface small. Three to five metrics, reviewed consistently, at every sprint retrospective. Not a dashboard that nobody reads between board meetings. A short, regular conversation, grounded in real numbers, with a clear question: is this number going up, down, or flat, and do we know why?
The goal of engineering metrics is not to grade the team. It is to see problems early enough to do something about them. That requires fewer metrics, not more.
What This Looks Like Without a Dedicated Analytics Function
Most mid-market companies do not have an engineering analytics team. They don't need one.
Release frequency can be tracked in a spreadsheet. Count how many production releases happened per week or per month. Plot it over time. Look for the trend.
Planning accuracy requires knowing what was committed at sprint start and what was actually completed at sprint end. This is a percentage. It takes five minutes to calculate after every sprint.
Defect escape rate requires counting bugs that were reported in production after a release. Your support tickets or bug tracker already has this data.
None of these require tooling investments. They require a consistent cadence of collection and a regular habit of review.
The Real Question
If you don't know your team's release frequency, you don't know whether your team is delivering. If you don't know your planning accuracy, you don't know whether your commitments can be trusted. If you don't track defect escape rate, you don't know whether your releases are safe to ship.
These are not advanced metrics. They are the minimum viable visibility into whether a software organization is healthy.
Sources
- Google/DORA, "2024 Accelerate State of DevOps Report" (survey of 39,000+ professionals). Performance cluster data: elite cluster stable at 19%; high cluster shrunk from 31% to 22%; low cluster grew from 17% to 25% in 2024. ↑
Frequently Asked Questions
What metrics should you track for engineering team health?
Three practical metrics predict engineering team health better than story points or tickets closed: (1) Release frequency: how often working software ships to production, which is the most honest proxy for whether a team's delivery pipeline is functioning. (2) Planning accuracy: what percentage of sprint-committed work actually gets done, which reveals information problems in estimation and scoping. (3) Defect escape rate: how many bugs reach production, which exposes quality discipline. These align with Google's DORA research across 39,000+ professionals.
Why are story points bad for measuring engineering performance?
Story points were designed as a planning tool, not a performance metric. Ron Jeffries, one of the creators of Extreme Programming, has written that story points should never have become a management metric. They were meant to help teams estimate relative effort for their own planning, not to let managers judge output. When story points become a target, engineers game them: estimates inflate, a 3 becomes a 5, and the numbers reflect the incentive rather than the effort. The same problem applies to lines of code, tickets closed, and PRs merged. These are activity metrics that say nothing about what is being produced.
What do the DORA performance clusters show about engineering teams?
Google's DORA research across 39,000+ software professionals identifies four performance tiers: elite teams deploy multiple times per day, high performers deploy daily to weekly, medium performers deploy weekly to monthly, and low performers deploy monthly or less. In 2024, the high-performing cluster shrank from 31% to 22% of respondents, while the low-performing cluster grew from 17% to 25%. The elite cluster held stable at 19%. The gap between top and bottom performers is not a matter of degree. It reflects a fundamentally different operating model.
Continue Reading
Your Engineering Team Has Most of the Right Practices. It's the Last Four That Make the Difference.
Most teams have the rituals but lack the results. The difference is four decision-quality practices.
Before You Bet 90 Days on AI: An Operator's Scoping Checklist
Most AI projects fail because they're scoped like technology rollouts, not process experiments.
Your AI Pilot Worked. That's the Worst Thing That Could Have Happened.
88% of AI proofs-of-concept never reach production. The problem isn't the technology.
Want to know if your engineering team is actually healthy?
I help mid-market companies replace vanity metrics with the three measurements that predict delivery performance. Let's talk.
Let's Talk